ISSN (online): 2575-3169 | DOI: 10.28966/PSESV
The Pacific States E-Journal of Scientific Visualizations (PSESV) has been developed to provide an avenue for the publication of electronic scientific visualizations of fisheries related data relevant to the region serviced by the Pacific States Marine Fisheries Commission (PSMFC) …
Read more
Editors-in-chief: Steven Barbeaux and Ben Fissel
View Editorial Board
Recent published articles
Visualizations of groundfish distributions from the Alaska Fisheries Science Center bottom trawl surveys
Steven J. Barbeaux 1 17 JANUARY 2018 10.28966/PSESV.2018.001
▼
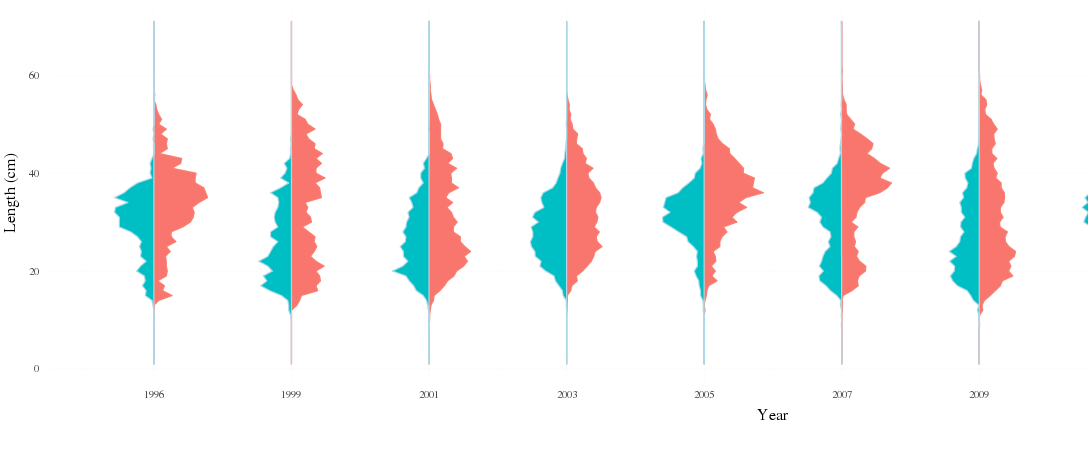
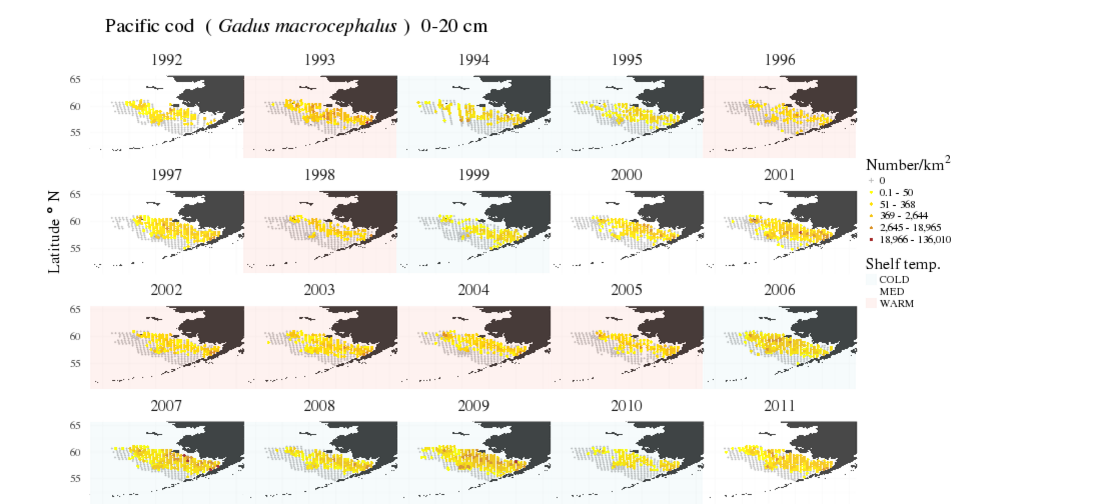
Visualization of the distribution and centroids of groundfish surveyed during the Alaska Fisheries Science Center standardized bottom trawl surveys of the eastern Bering Sea (EBS) shelf, Gulf of Alaska shelf, Aleutian Islands shelf and eastern Bering Sea Slope are provided. During these surveys researchers have collected species composition and bottom temperature for all tows as well as measurements from all fish species encountered. These data have been used to create visualizations of spatial distribution and distribution by bottom depth and temperature by length bins for all available surveys for groundfish and skate species where adequate length data have been collected ( >2000 specimen per species per survey). This provides a unique look at the spatial and environmental preferences of a wide variety of species, as well as ontogenetic shifts in spatial distribution and environmental preferences. The visualizations provided are meant to facilitate a better understanding of the life histories of these species over time and space and provide clues to how climate change may potentially impact species at different life stages.
Economic Status of the Groundfish Fisheries off Alaska Data Visualizations
Ben Fissel 2 2 MAY 2019 10.28966/PSESV.2018.002
▼
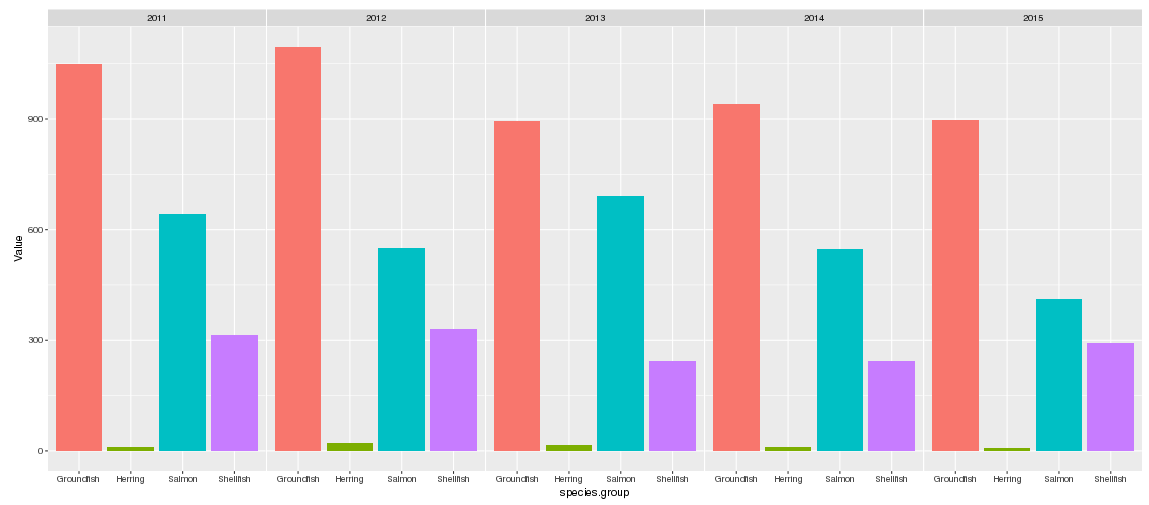
Visualization of selected ex-vessel, first-wholesale, and effort statistics from the Groundfish Economic SAFE report
Spatial and temporal visualizations of satellite-derived sea surface temperatures for Alaska fishery management areas
Jordan T. Watson 3 3 JUN 2019 10.28966/PSESV.2019.003
▼
A common pursuit in fisheries research is to understand the relationship between fisheries data and the surrounding environment. However, environmental data are often unavailable at similar scales as fishery data. To mitigate this disconnect, more than 6,000 daily satellite datasets (containing ~ 24 billion individual temperature records) from 2003—2019 were rectified with spatial fisheries management areas. This union facilitates a smoother linkage between satellite-derived sea surface temperatures and the spatial management units often used by state and federal scientists in Alaska. Visualizations of these data help users to explore the spatial (e.g., state and federal management grids) and temporal (e.g., daily, weekly, monthly) scales of the data and allow users to filter, download, and visualize trends. For users in regions outside of Alaska, R code can easily be modified for different spatial regions to integrate NASA or other environmental satellite data with spatially-explicit fishery information.